Detecting the Trend Behind the Greenhouse Gas Emissions Ranking
 Facebook
 Twitter
 Linkedin
 Google +
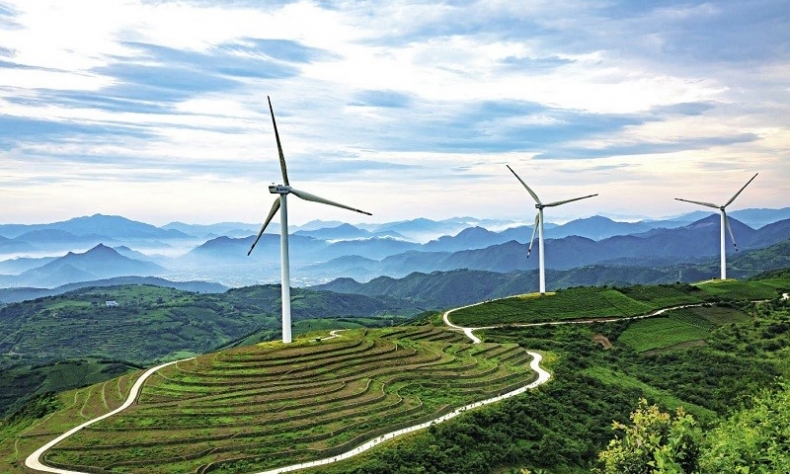
Satellite data shows that more than a quarter of the world’s newly added green space between 2000 and 2017 was found in China, making it the largest contributor to the global landscape’s greening.
According to the Greenhouse Gas Emissions by Country 2021 recently released by the U.S.-based World Population Review, China still leads the world in total carbon dioxide emissions, hitting 2,806,634 million tons (Mt), followed by the United States at 1,432,855 Mt, and then India, Russia, Japan, and Germany successively. However, based on the population data of the organization’s website, China’s CO2 emissions per capita do not even make it into the top ten countries with Saudi Arabia at the top of the list with 4.64 Mt, closely followed by the United States with 4.30 Mt, then Canada, Australia, Russia, South Korea, Japan, Germany, South Africa, and Iran. China ranks 11th with 1.94 Mt.
Many studies have shown the inextricable connection between population and greenhouse gas emissions. A study by Paul Murtaugh of Oregon State University indicated that “carbon legacy” of one child can generate 20 times more greenhouse gas than a person will save by recycling or using energy-efficient appliances or other means to reduce the carbon footprint. According to the Center for Biological Diversity, the size of the carbon legacy is closely associated with consumption patterns. “Under current conditions, a child born in the United States will be responsible for almost seven times the carbon emissions of a child born in China and 168 times the impact of a child born in Bangladesh,” an article posted on its website said. In addition, economic globalization can also disguise the carbon footprint of individual nations. Some emerging economies have become the world’s leading greenhouse gas emitters. But a sizable portion of those gases is generated by manufacturing consumer goods for developed countries.
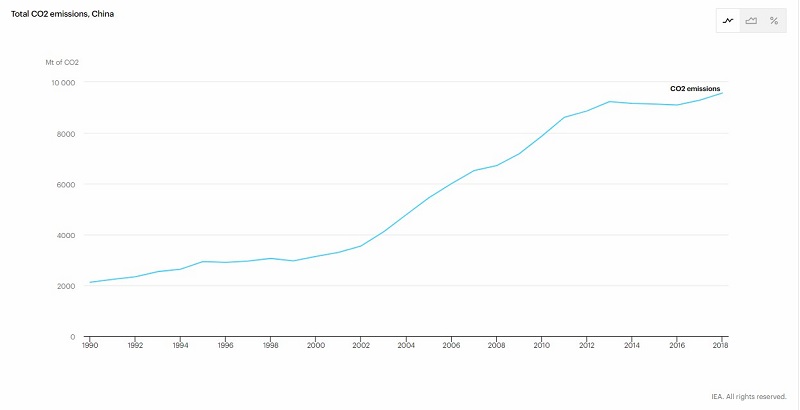
After Rhodium Group published its report earlier this year on global greenhouse gas emissions in 2019, many Western media outlets hyped the fact that China’s overall greenhouse gas emissions contribute to more than 27 percent of the global total, exceeding those of the U.S. and other developed nations combined.
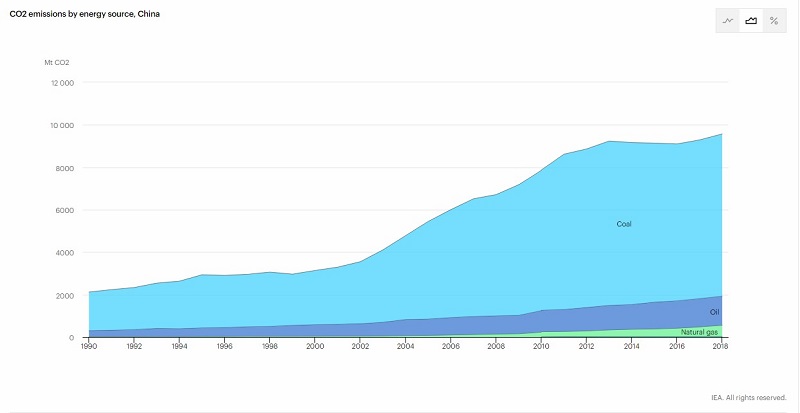
However, what they have ignored is the overall slowing down of China’s CO2 emissions growth over the past decade. According to the data from International Energy Agency (IEA), China saw the first peak of its CO2 emissions from coal in 2013 at 7,735 Mt, which gradually declined to 7,384 Mt in 2016. Although it later climbed to 7,637 Mt in 2018, the overall growth rate has been reduced. The growth of CO2 emissions from oil during the same period in China has also been steady at an average annual rate of 3.6 percent. Combustion of coal and oil is still the major source of the country’s CO2 emissions. During the period of 2013-2018, China’s annual CO2 emissions growth rate was 0.73 percent based on the IEA data.
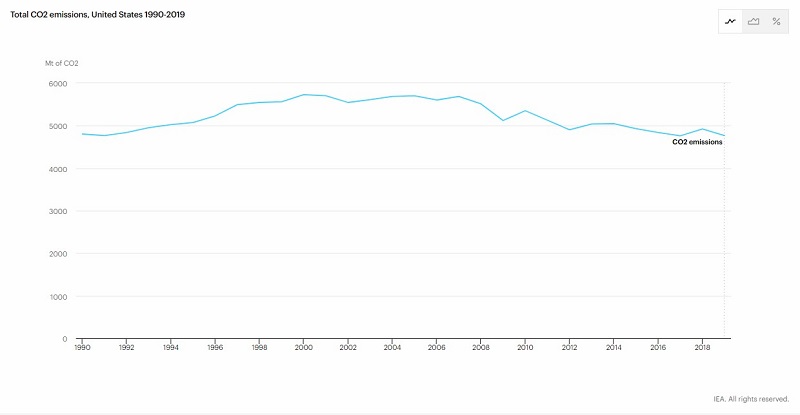
Although the United States has shown an overall decline trend of its CO2 emissions over the past decade, 20 or more years ago when the country was still the world’s largest CO2 emitter, its growth rate in CO2 emissions was faster than China’s current rate of 0.73 percent. According to the IEA data, the total CO2 emissions of the United States stood at 4,952.8 Mt in 1993; the figure increased to 5,545.4 Mt in 1998 with an average annual growth rate of 2.4 percent.
Since Chinese President Xi Jinping proposed China’s ambitious and inspiring goal to reach a CO2 emissions peak before 2030 and achieve carbon neutrality before 2060, China has been on the move to set phased targets and roll out specific measures to facilitate the transition. According to the 2021 Report on the Work of the Government, during the period (2021-2025) of the 14th Five-Year Plan for Economic and Social Development, China’s energy consumption per unit of GDP and carbon dioxide emissions per unit of GDP will be reduced by 13.5 percent and 18 percent respectively. China’s national carbon market started online trading on July 16, an important step for helping the country reduce its carbon footprint and cope with climate change. Carbon emissions from more than 2,000 power companies listed in the first batch of trading are expected to exceed 4 billion tons per year, thus making the market the world’s largest by volume of greenhouse gas emissions covered.
The State Council Information Office holds a press conference on China’s national carbon emissions trading market in Beijing on July 14, 2021. (Photo by Liu Jian/Xinhua)
A greenhouse gas refers to a type of gas that traps heat in the atmosphere. Greenhouse gases are key factors in increasing global warming. In the Earth’s atmosphere, primary greenhouse gases include water vapor, carbon dioxide, methane, nitrous oxide, and ozone. Of these, carbon dioxide is the most abundant greenhouse gas. Data shows that since 1970, global CO2 emissions have increased by 90 percent, with emissions from fossil fuel combustion and industrial processes contributing to about 78 percent of the total increase of greenhouse gas emissions.
The development of the Saihanba Mechanical Forest Farm, where now stands an almost 70,000-hectare stretch of forest — the world’s largest single afforested patch — is among the most representative cases of China’s afforestation.
According to China’s position paper for the UN Summit on Biodiversity, released on September 21, 2020, between 2009 and 2019, China led the world in forest and tree resource increment with a total of 71.307 million hectares of afforested land. Satellite data shows that more than a quarter of the world’s newly added green space between 2000 and 2017 was found in China, making it the largest contributor to the global landscape’s greening. Forests, grasslands, and wetlands are important carbon sinks to absorb carbon, helping a country to realize carbon neutrality.