How Does China Contribute to Efforts to Protect the Earth?
 Facebook
 Twitter
 Linkedin
 Google +
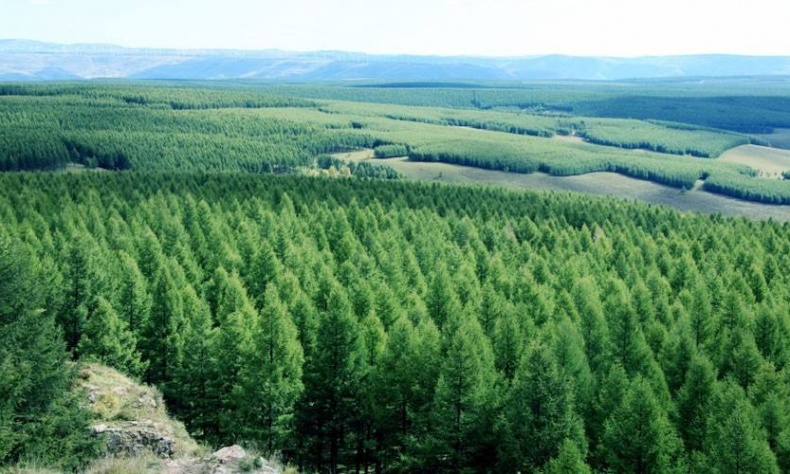
China is home to the largest artificial afforestation area in the world
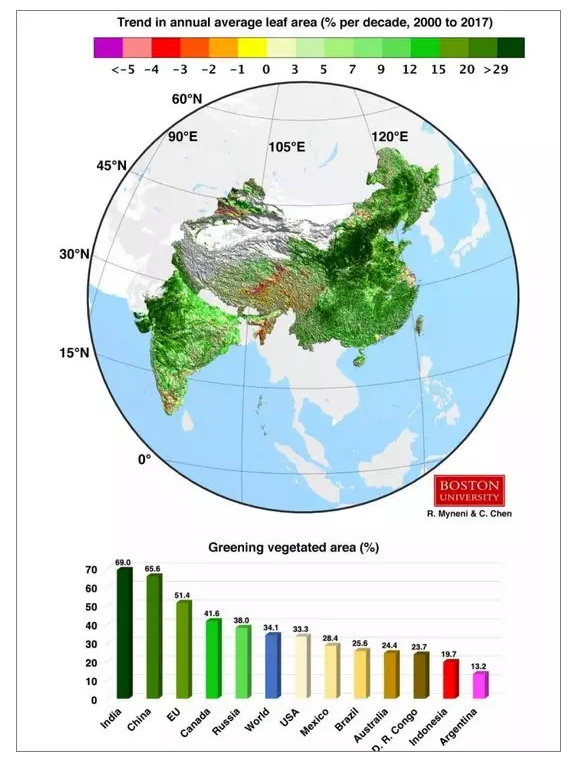
The earth has become greener, with China taking the lead.
This conclusion has been reached from data compiled by Aqua and Terra — NASA’s earth observation satellites.
From 2000 to 2017, the global areas covered by greenery increased by 5%, of which, 25% of such territory lies in China. In fact, China only accounts for 6.6% of global vegetation coverage. So, how did these changes happen?
To this end, we have invited experts from the Institute of Remote Sensing and Digital Earth of the Chinese Academy of Sciences who have been engaged in monitoring vegetation change for a long period of time, to explain the process with a complete series of digital and satellite remote sensory images.
Earlier this year, a multinational cooperative research paper led by Boston University and mainly funded by NASA was published in Nature Sustainability. The paper entitled China and India Lead in Greening of the World Through Land-use Management found that during the period from 2000 to 2017, China and India dominated global land greening (increases in leaf-covered areas). More importantly, in the process of turning China green, forests contributed 42%, greater than the 32% contribution of agricultural land and much more than India’s forest contribution of 4.4%.
Over the Years, What Has China Done to Protect the Earth?
China’s afforestation and forest protection are crucial parts of the results achieved.
Since the 1970s, China has successively launched many major ecological projects, of which at least six projects are directly related to land greening: the “Three-North” Shelter Forest Program, the Natural Forest Resource Protection Project, the Project of Returning Farmland to Forest (Grass), the Shelterbelt Forestry Project of the Yangtze/Pearl River Basin, the Beijing-Tianjin Sandstorm Source Control Project and the Project of Returning Grazing Lands to Grasslands. These projects cover most of the regions of China.
Beginning in 1979, the “Three-North” Shelter Forest Program involving 13 provinces, municipalities and autonomous regions, has achieved a total construction area of 4.069 million square kilometers, accounting for 42.4% of China’s total land area, with total investment of more than 50 billion yuan so far.
Beginning in 1998, the Natural Forest Resource Protection Project involving 17 provinces, 724 counties, 160 key enterprises and 14 nature reserves, reached cumulative investment of 48.83 billion yuan by 2004.
Having been started in 1999, the Project of Returning Farmland to Forest (Grass) involves 25 provinces and autonomous regions and 1,897 counties. It is one of the largest ever ecological project to be carried out worldwide. The central government alone has invested more than 430 billion yuan in the project.
Phase I of the Shelterbelt Forestry Project of the Yangtze/Pearl River Basin was carried out between 1989 and 2010. According to forest inventory data and the forestry statistical yearbook, a total of 63,000 square kilometers of forest were planted and 55,000 square kilometers were afforested. The Phase II covers a wider range, of which the Shelterbelt Forestry Project of the Yangtze River Basin Phase II includes 1,033 counties (municipalities, districts) in 17 provinces (municipalities) with a planned afforestation task of 69,000 square kilometers.
Having begun in 2002, the Beijing-Tianjin Sandstorm Source Control Project involves 75 counties across five provinces (autonomous regions and municipalities) including Beijing, Tianjin, Hebei, Shanxi and Inner Mongolia, with a total area of 458,000 square kilometers. The initial estimated investment for Phase I is 55.8 billion yuan.
Since 2003, the Project of Returning Grazing Lands to Grasslands has covered 640,000 square kilometers in seven northern provinces and autonomous regions. The central government has invested 29.57 billion yuan in the project.
These Data Illustrate the Reasons Behind this Green Miracle.
The most effective way to understand the results of these afforestation projects in China is to observe changes in collected data. In the field of ecological environment change monitoring, the most widely used technology is that of acquiring images of the earth for continuous monitoring through remote satellite sensing.
Here are a few sets of data and images which illustrate the reasons behind this green miracle.
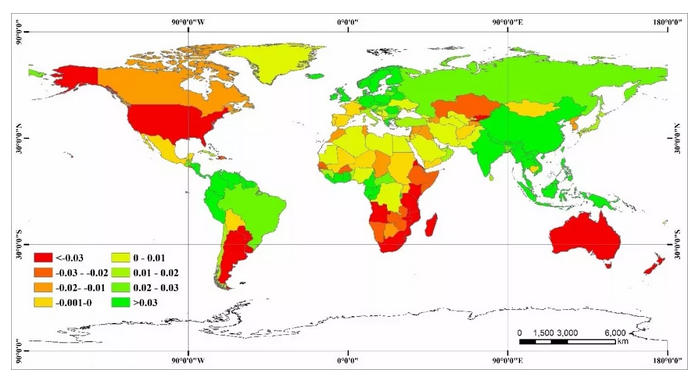
In the field of remote sensing application, the index for evaluating vegetation coverage and vegetation growth is called the “vegetation index”, of which the “normalized difference vegetation index” (NDVI) is most widely used. The higher the NDVI, the higher the vegetation coverage.
The calculation shows that the NDVI in China, India and most European countries showed significant increases in 2015 compared with 1982, indicating that the land of these countries has turned significantly green. However, the NDVI in North America, Australia, Africa and South America showed a decreasing trend.
 Another measurement indicator is net primary productivity (NPP).
NPP is the amount of photosynthetic products or organic carbon formed by plants after converting the carbon dioxide in the atmosphere through photosynthesis, and is the material basis for the survival and reproduction of other organisms in the ecosystem.
Analysis of the spatial distribution and annual changes of NPP on a global scale compared country-to-country from 2000 to 2014 show that 53 countries account for more than 90% of the total NPP on the global national scale, while the countries ranked in the top three and top 12 account for 30% and 60% of the total NPP on the global scale, respectively. China accounts for about 5% of the world’s total NPP, ranking 4th globally. However, it cannot be ignored that western China is mostly desert or home to areas of sparse vegetation, and the average NPP per unit area is about 300gC/m2/y — not high in the global ranking, at a similar level compared to Canada, Australia, India and other countries.
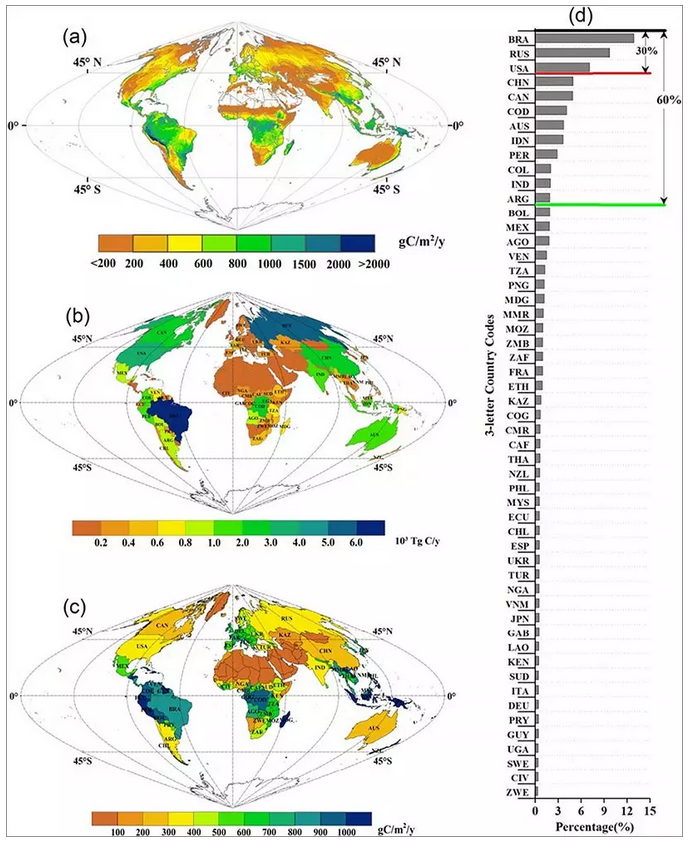
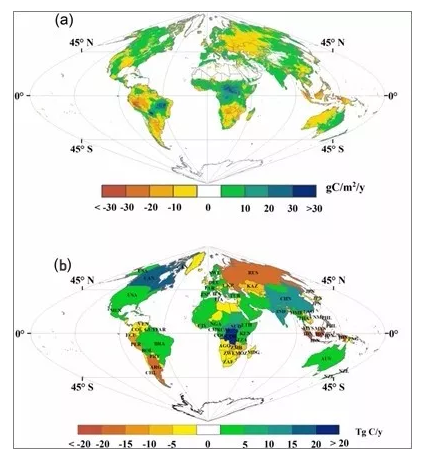
According to the trend of change from 2000 to 2014, NPP in large parts of China is rising, especially in western regions. Among several countries with high NPP, China’s NPP has increased by about 11Tg C per year, far exceeding that of Brazil (5Tg C/y) — ranking 1st in terms of total NPP — and the United States (2Tg C/y) — ranking 3rd.
For the NPP rate of change in China from 2000 to 2014, most areas of the “Three-North” Shelter Forest Program show an increasing trend, especially in Shaanxi Province.
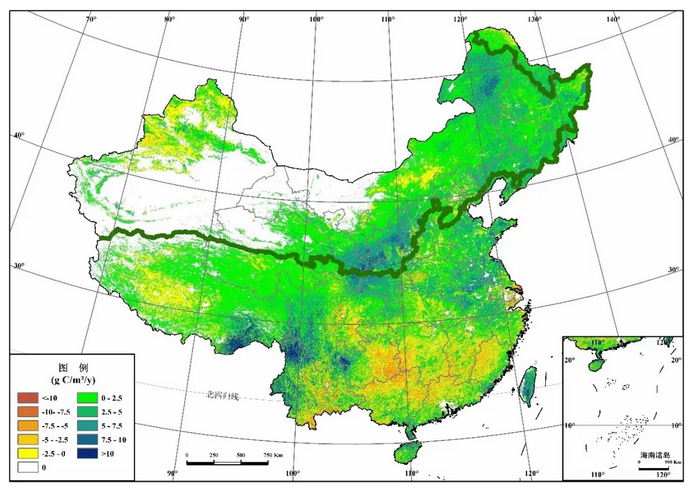 Spatial distribution of the inter-annual variation rate of NPP at the pixel scale in China from 2000 to 2014 (The dark green thick line in the figure is the boundary line of Phase V of the “Three-North” Shelter Forest Program)
In addition to the statistical changes, the image is fairly self-explanatory.
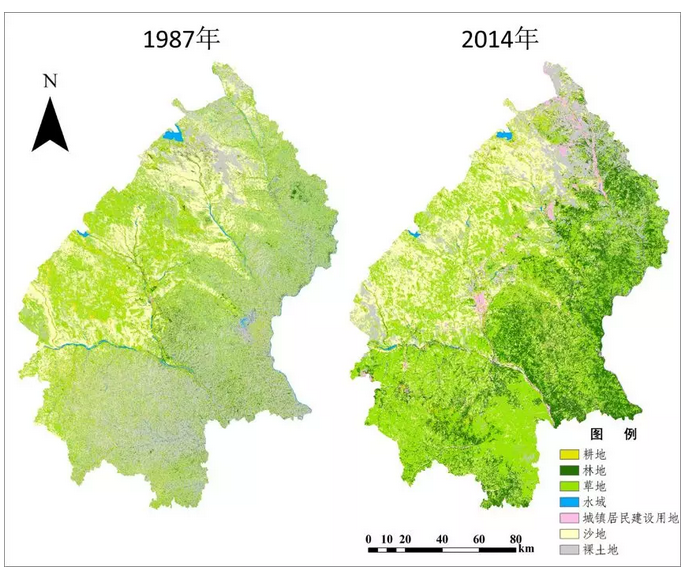
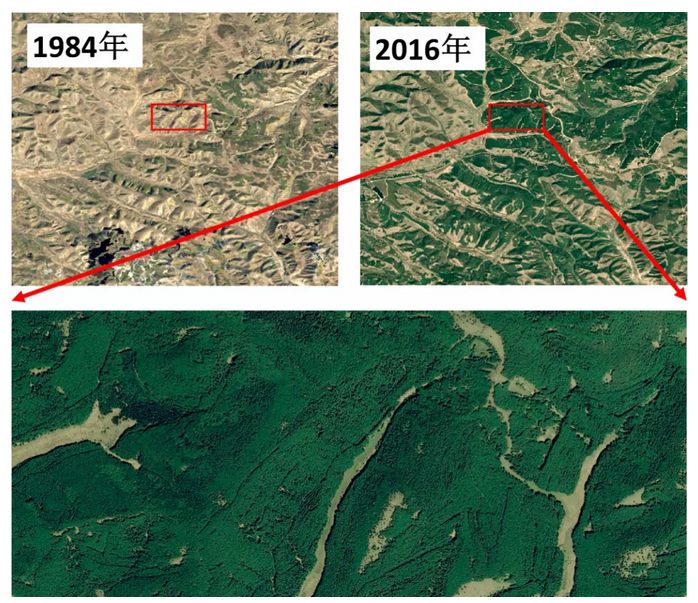
The first area reviewed is the city of Yulin in Shaanxi Province.
According to the classification of the data from the American Landsat series satellite photographs of 1987 and 2014, the forested land area in Yulin in 2014 was about four times higher than that of 1987, and the bare soil area in 2014 was only one quarter of that of 1987. In addition, the grassland area increased by 3,000 square kilometers.
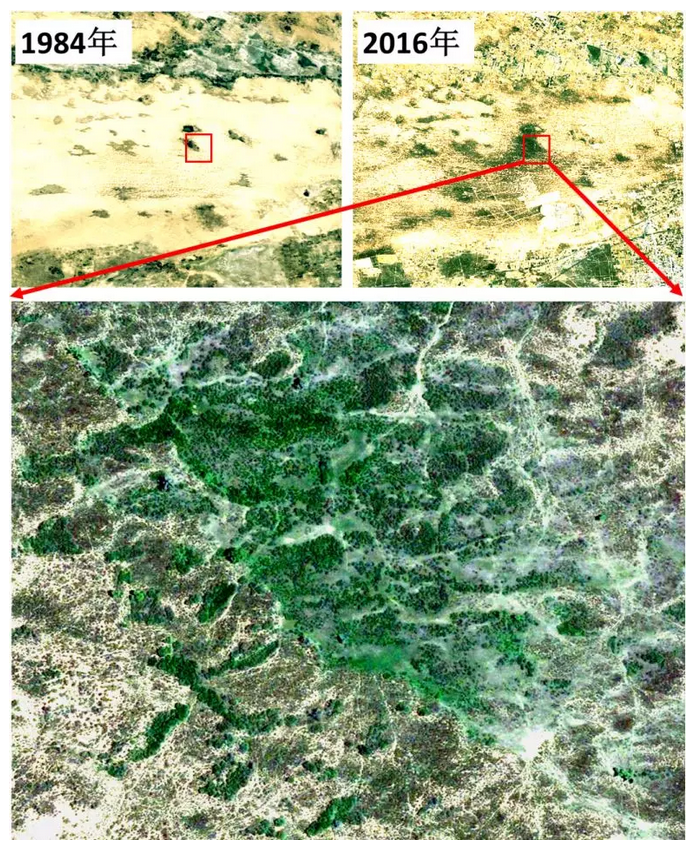
 The following two satellite images show Yulin clearly. It was a large area of sand or bare soil in 1984, but was covered in vegetation by 2016.
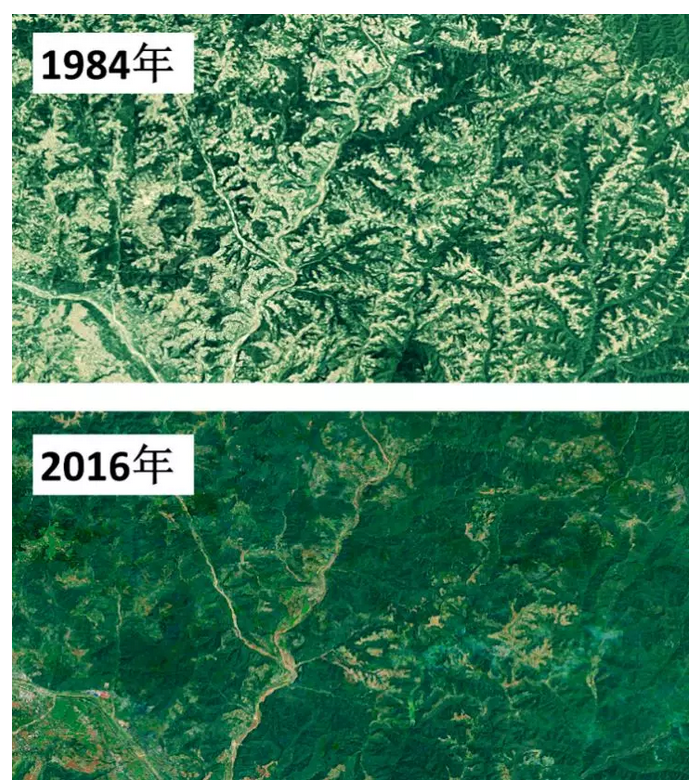
Another illustration covers the city of Baoji in Shaanxi Province.
Although there was some vegetation in the vicinity of Baoji in 1984, the vegetation coverage rate was only about 40%, while 32 years later in 2016, the vegetation coverage rate exceeded 90%. According to the China Forestry Statistical Yearbook, between 2002 and 2016, Baoji introduced a total afforestation area of 4,064.9 square kilometers, including an artificial afforestation area of 2,117.06 square kilometers, an aerial afforestation area of 779.51 square kilometers and newly closed hillsides for afforestation of 1,168.33 square kilometers.
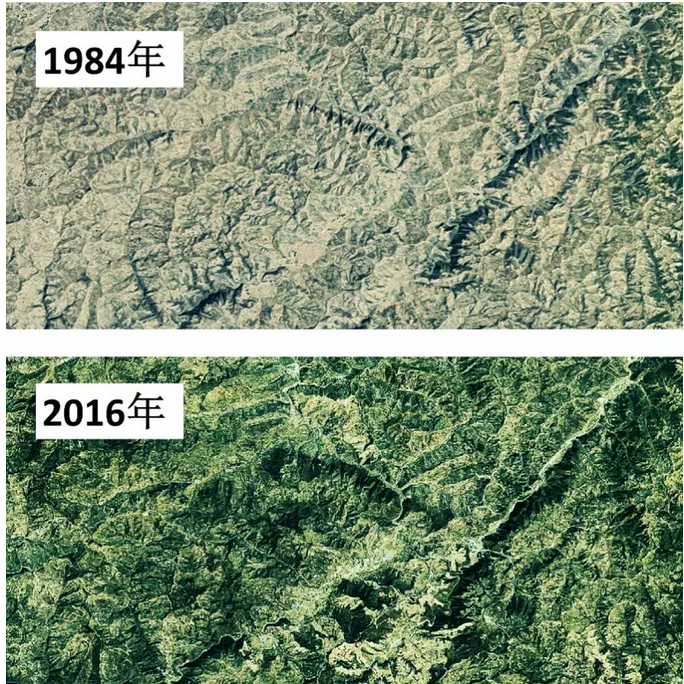
The next illustration is the city of Tianshui, Gansu Province.
The satellite images show that during the 1980s, most of the land in the area was bare. According to the China Forestry Statistical Yearbook, between 2002 and 2016 alone, Tianshui benefited from afforestation of 3,427.56 square kilometers, including artificial afforestation of 2,877.52 square kilometers, afforestation by aerial seeding of 29.45 square kilometers and newly closed hillsides for afforestation covering 520.59 square kilometers. Today, Tianshui is a lush city, enjoying the title of “Little Jiangnan ” in the northwest.
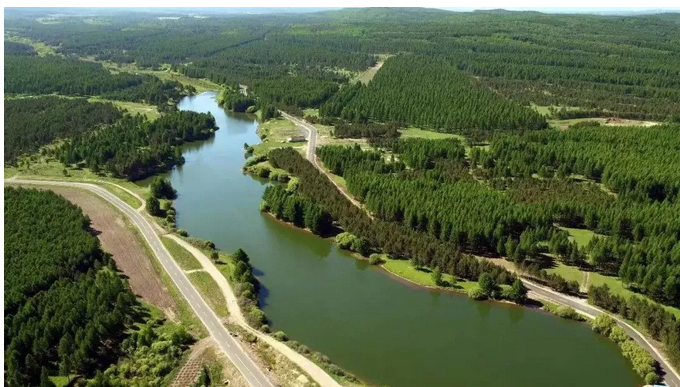
The most noteworthy is the green miracle — Saihanba, Hebei Province.
The two satellite images below show that the forest coverage rate of Saihanba increased significantly in 2016 compared to 1984.
This photo shows that the Saihanba area was basically desert before the founding of the People’s Republic of China. After more than 50 years of unremitting efforts across three generations, the forest coverage rate of Saihanba increased from 11.4% to 80%. Now, Saihanba is a contiguous artificial forest. In December 2017, the United Nations Environment Programme announced that the builders of the Saihanba Forest Farm in China were to be awarded the “Champions of the Earth” prize in 2017 — the United Nations’ highest honor for environmental protection.
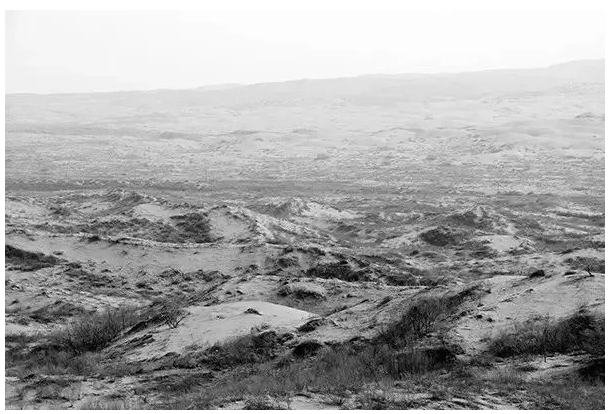
Saihanba desert before the founding of the People’s Republic of China. Now, Saihanba is home to the largest contiguous artificial forest in China.
- China is home to the largest artificial afforestation area in the world, and its forest coverage rate has reached 22%.
- In tackling climate change and saving the earth, China has been moving forward with earnest.
- Green hills and clear waters are gold & silver mountains, in the future, an even greater number of places in China will be home to green miracles, transforming deserts to forests.
Author/Associate Researcher Peng Dailiang, Graduate Student Zhang Helin, Researcher Zhang Bing, the Institute of Remote Sensing and Digital Earth of the Chinese Academy of Sciences
Editor/Dong Lingyi